 Photo by Yash Menghani on Unsplash
Process Monitor is a tool on Windows systems that helps you monitor for issues on your system. You can view process, registry, filesystem, and network activity in real-time.
Process Monitor was born when Mark Russinovich and Bryce Cogswell created RegMon “Registry Monitor” and its sister application Filemon “File Monitor”. The two tools combined to form the earliest version of ProcMon “Process Monitor”. Some tools available today that provide similar levels of detail in real-time about the operating system are SpyStudio.exe, Sysmon.exe, Procexp.exe, and perfmon.exe.
Sysadmins often use ProcMon to troubleshoot issues that are otherwise hard to detect on the operating system. Security professionals use it to monitor critical processes and spot potentially malicious behavior. Today, we are going to go through the basics of using ProcMon.
Installing Process Monitor
But first, let’s install ProcMon! Go to Microsoft’s website to download Process Monitor.
Process Monitor — Windows Sysinternals
Extract the downloaded file “ProcessMonitor.zip” to your desktop. You will see a file named “Procmon.exe”. Run Procmon.exe to open up the application.
Using Process Monitor
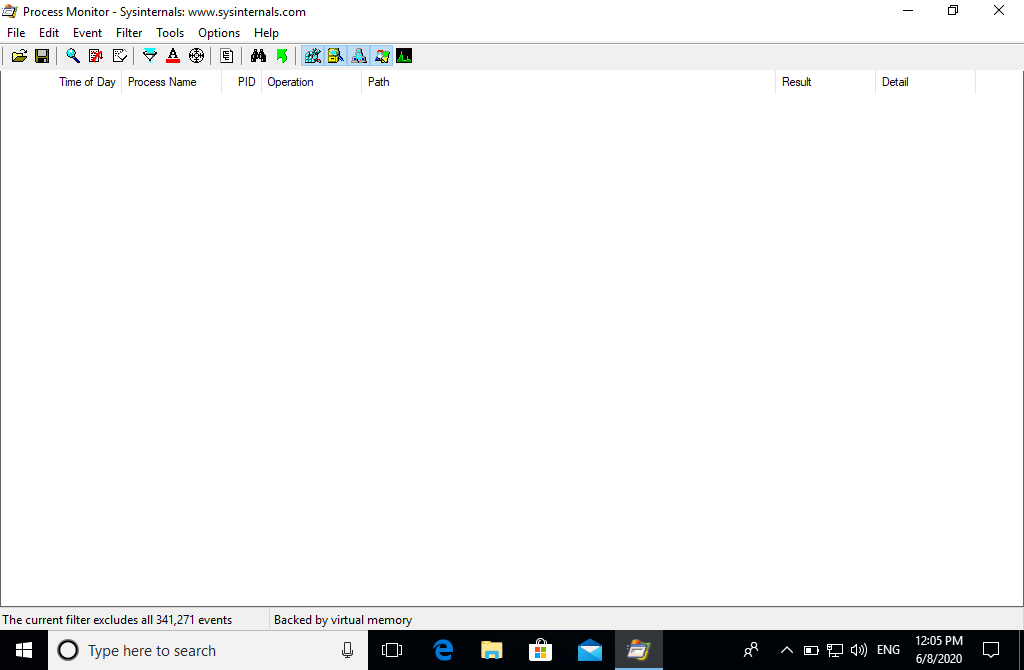
After opening ProcMon, you will see a window like this.
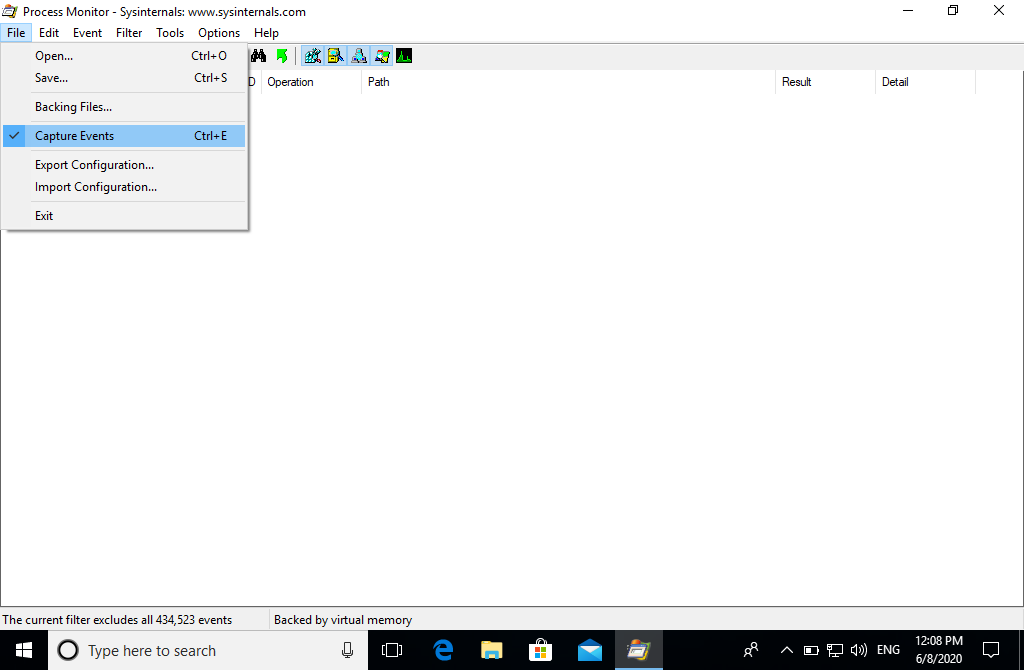
You can start capturing events by going to “File” and checking “Capture Events”.
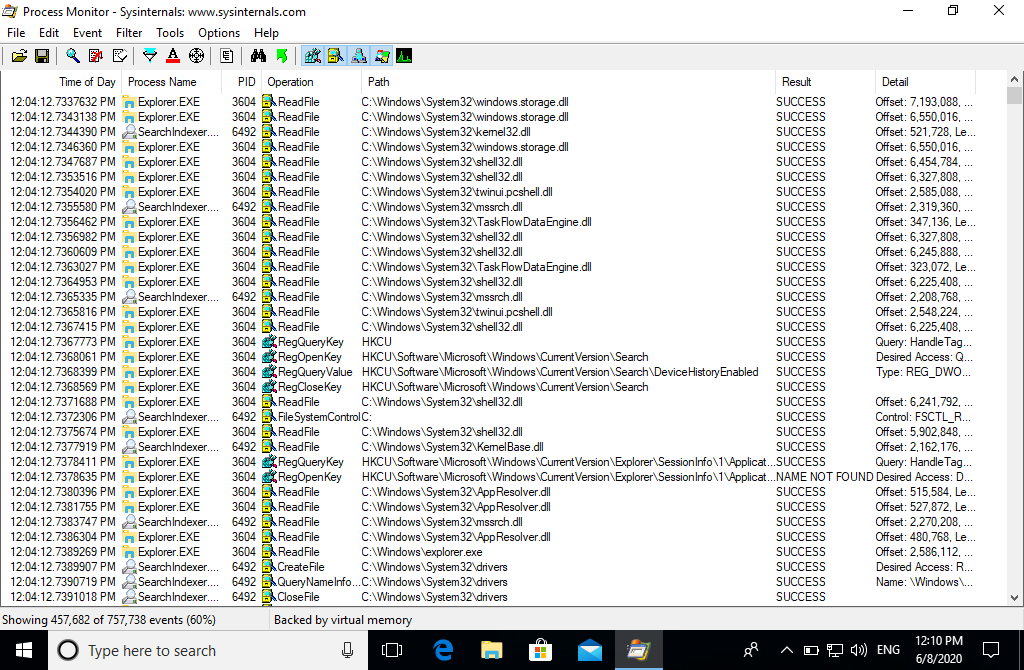
You should see events showing up in your window.
Saving the capture
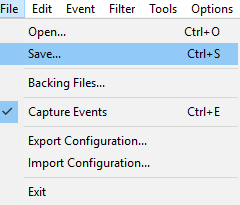
Save your capture files by going to “File > Save”. ProcMon gives you the option of saving only filtered events and saving the capture file in multiple different formats.
ProcMon filters
ProcMon filters allow you to filter specific events and exclude the ones that you don’t want to see. To quickly switch between event types you can use the buttons located in the top toolbar.

You can also adjust which events are shown in your window using more detailed filters by going to “Filter > Filter…”.
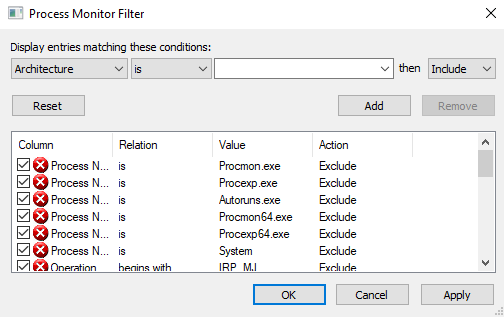
You can filter events by process ID, username, time, date, and more. For example, to view the Process with the name “Procmon.exe”, you can set the filter conditions to “Process name is Procmon.exe then Include”. Click on “Add” to add the new filter to your filter list. Uncheck the boxes next to unwanted filters on your list to remove it. Finally, click on “Apply” to apply your list of filters.
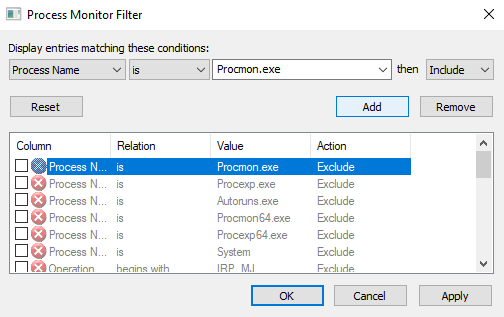 You should now only see the events that fit your filter criteria.
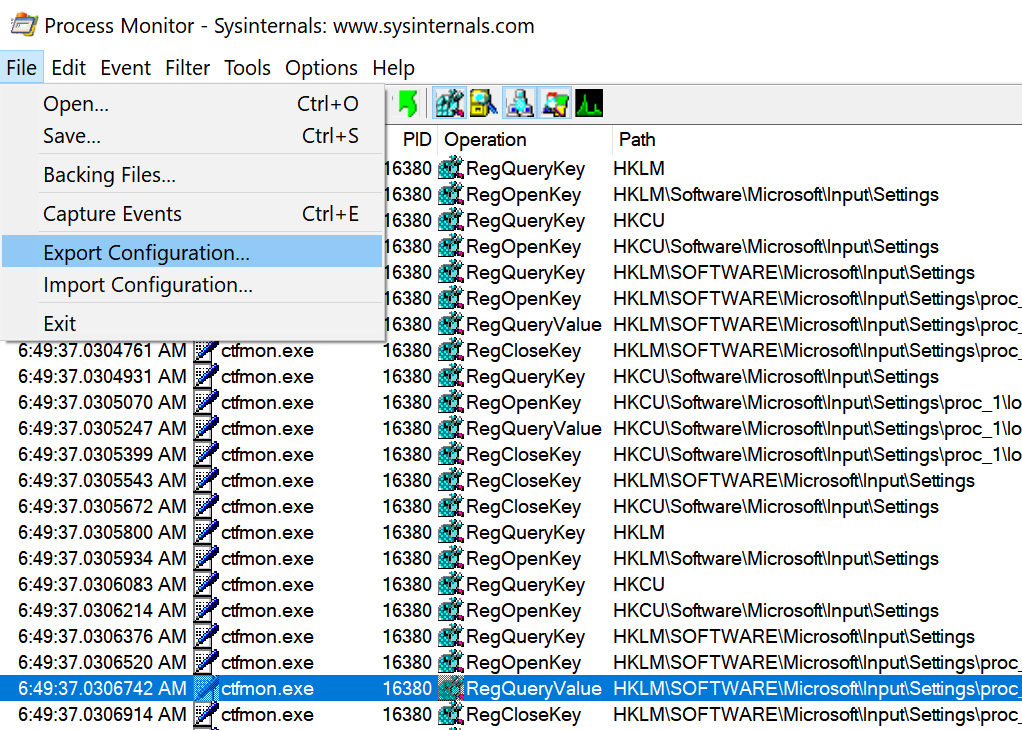
Once you have designed a filter you can export it by going to “File > Export Configuration”. This allows you to save the filter settings to use later on. You can also import it when parsing ProcMon logs with other tools like the PowerShell.
Process tree
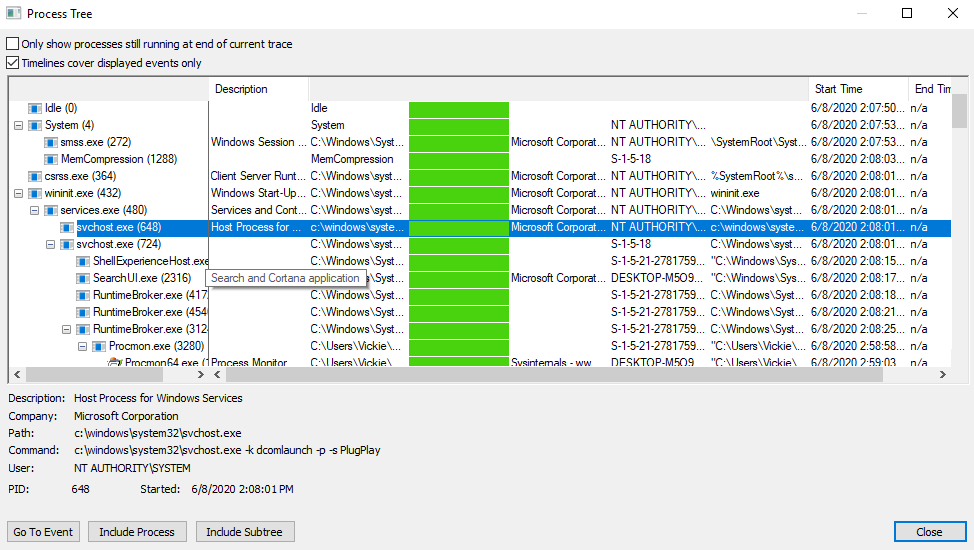
There is also a useful feature in ProcMon called the Process Tree. You can access it by going to “Tools > Process Tree”.
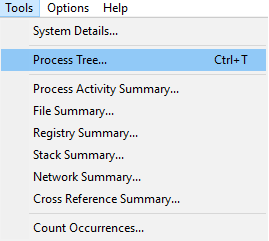
The Process Tree shows the parent-child relationships of all processes. This will give you insight into processes and their orders of execution. Click on a process to examine its details in the panel below.
Using Process Monitor in the command line
On the other hand, you can also perform Process Monitor actions in the command line if you prefer.
C:\Tools\SysinternalsSuite\Procmon.exe
Here are several command-line options of ProcMon that you will need to know.
-
/AcceptEula: Accepts the license to bypasses the dialog. -
/Quiet: Do not prompt to confirm filter settings. -
/Backingfile FILE_NAME: Create the file and use as output file. -
/Runtime SECONDS: Capture for a number of seconds then stop.
For example, you can log events directly into a file located at “C:\Users\Admin\Desktop\ProcmonLog.PLM” with this command.
C:\Tools\SysinternalsSuite\Procmon.exe /Quiet /AcceptEula /Backingfile C:\Users\Admin\Desktop\ProcmonLog.PLM /Runtime 100
You can also launch ProcMon with an existing filter file, and output the filtered events to a specific file format with by using these parameters.
-
/LoadConfig PATH_TO_FILE: Use the specified filter and settings file. -
/SaveAs FILE_NAME: Export the log file into CSV, XML, or PML format.
This command will use the preconfigured filter file located at “C:\Users\Admin\Desktop\Filter.pmc” and convert the filtered events to XML format so that they can be analyzed by other tools.
C:\Tools\SysinternalsSuite\Procmon.exe /Quiet /LoadConfig C:\Users\Admin\Desktop\Filter.pmc /SaveAs C:\Users\Admin\Desktop\ProcmonLog.xml
Using ProcMon filters before saving the log file is important, because ProcMon captures hundreds of thousands events in a very short amount of time. Loading an unfiltered XML log file into PowerShell would be extremely resource intensive taking a long time.
Parsing log files using PowerShell
After saving the desired events into a log file, you can parse log files using PowerShell and sort through the events.
First, read the saved XML file and assign it to a variable.
$inputFile = [xml](Get-Content C:\Users\Admin\Desktop\ProcmonLog.xml)
Then, retrieve the filtered events from the XML object.
$Events = $inputFile.procmon.eventlist.event
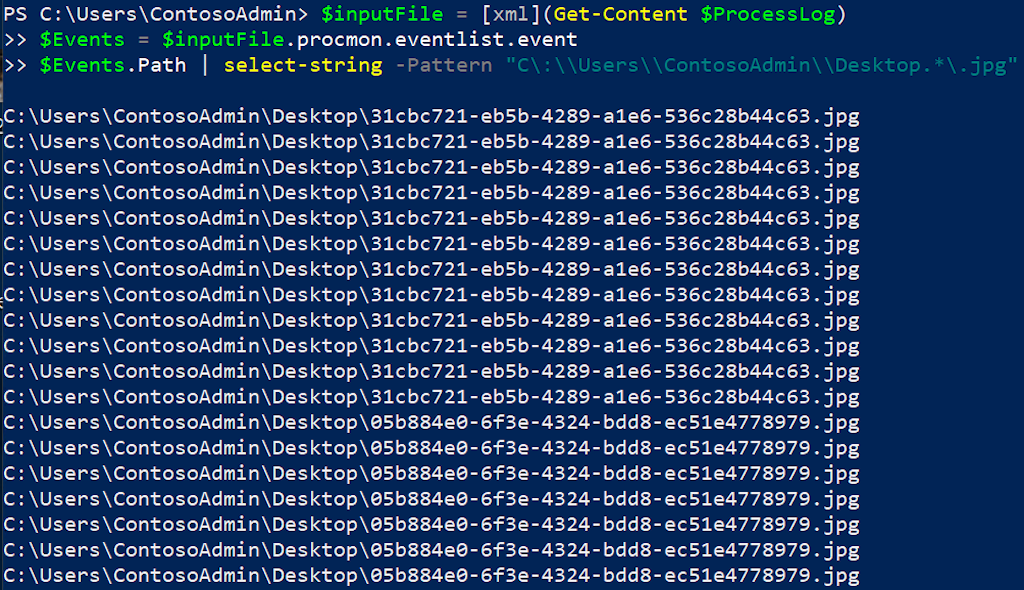
Very often there are still too many events to go through manually. You can apply a regex pattern to filter out the exact details required from the remaining events,.
$Events.Path | Select-String -Pattern '.* -> (ec2.*[amazonaws.com]):http').matches.groups[1].value | Select-Object -First 1

$Events.Path | Select-String -Pattern "C\:\\Users\\Admin\\Desktop.*\.jpg" | Select-Object -First 1
Conclusion
Process Monitor allows you to monitor system processes in real-time. You can use ProcMon on its own or you can combine it with other tools to create an automatic monitoring system!

